Hello! Let me first clarify, this is for a personal project, based on an idea I always use to learn all kinds of things: personal finance tracking.
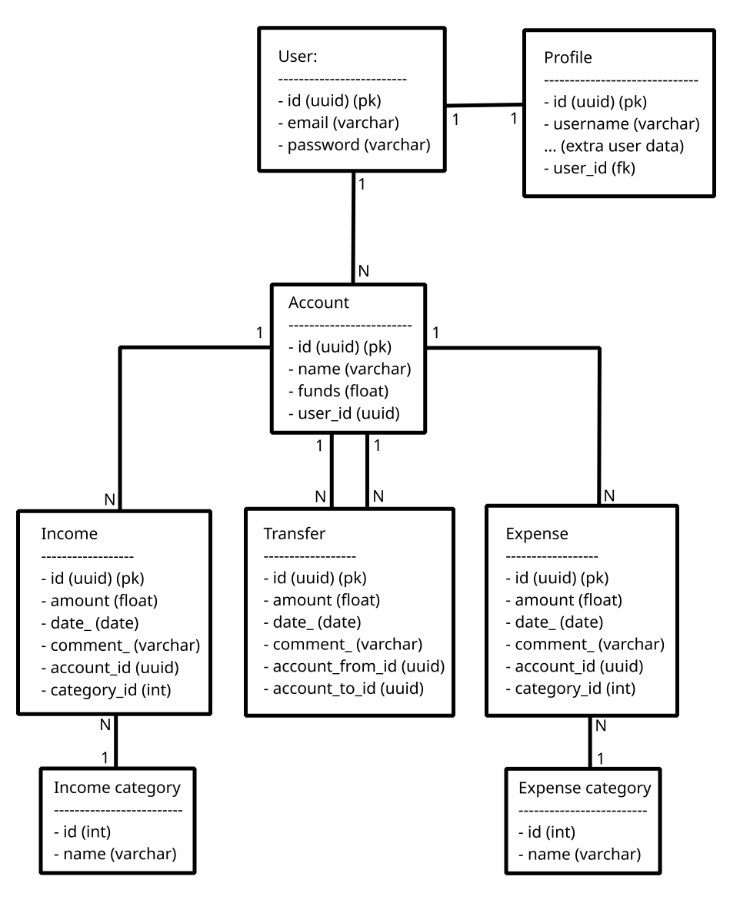
The DB model I typically use looks something like this:

Initially, I made the decision to separate incomes, expenses and transfers into separate tables, which makes sense to me, according to the way I learned DB normalization.
But I was wondering if there is any benefit in somehow mixing the expense and income tables (since they are almost identical, and any code around these is always almost identical), or even all 3 (expense, income and transfer). Maybe it is more convenient to have the data modeled like this this for an API, but for BI or analytics, a different format would be more convenient? How would such format look like? Or maybe this would be better for BI and analytics, but for an API it’s more convenient to have something different?
A while ago at a previous job, an experienced software architect once suggested, for a transactional system, to separate the transactional DB from a historical DB, and continuously migrate the data differences through ETL’s. I have always thought that idea is pretty interesting, so I wonder if it makes sense to try in my little personal project.
If it was you, how would you model personal finance tracking? Is there something you think I may be missing, or that I should look into for DB modeling?
(Note: I intentionally do not track loans / investments, or at least I have not tried to integrate it for the sake of simplicity, and I have no interest in trying YET.)
All three should be one table, at least based on the diagram and your description. Read this https://martin.kleppmann.com/2011/03/07/accounting-for-computer-scientists.html.
Look into the concept of sub-ledgers if you’re wanting some additional tables along with the general ledger.
Past that, historical balances being rolled up by various dimensions is another thing I’ve done. No point in continuously summarizing the GL from the beginning of time when those values should never change and people only care to see summary values for a period.
Beautiful! What a fantastic article. So in a way, there’s only accounts, and types of accounts, and transfers between accounts. I knew there must have been something I was missing. Definitely will take a closer look at accounting practices and software before my next project. Thanks a lot!
In my mind, tables being identical is indeed a code smell. Combine them and add a type column, if you’re going for normalization.
The one exception, for me, would be if there’s a performance issue. For example, I frequently work with data where we want to maintain history, and the easiest way to do that is to dupe each record, every time it changes. A “normalized” solution would have you do that in the same table, and just add a version ID to each record. But with a high volume of data (that you’re probably going to use VERY sparingly) that may either cause reduced performance, or just be annoying to deal with (I.E. constantly having to remember to filter to just the most-recent versions).
Also, from a higher-level business perspective, look into ledger-based accounting. It’s the generally-used system among professional accountants and accounting software. One transactions (or distributions) table (I.E. the ledger) contains all movement of money, in the form of dollar amounts being moved from a source account to a destination account. Accounts are categorized as Expenses, Income, Assets, or Liabilities (also sometimes Equity). So, if you pay an electric bill, that’s just a transaction/distribution moving money from an Asset account (E.G. “Checking XXXX”) to an expense account (E.G. “Utilities: Electricity”). Tracking expenses and income becomes simply a matter of looking at account balances, and auditing is performed by making sure all account balances, when they’re tracked ot built maybe from separate systems, or separate ledgers, add up to $0.
I agree I should get a grasp on ledger based accounting before my next project. Thanks for pointing me in the right direction!
I’d probably combine these to allow for a single load audit, and move the specific values to satellite tables based upon type. Of course, another way to do that would be the design you have but with an additional read model table for the audit, which you’d update upon insertion,
Of course, just because things look similar doesn’t mean they are the same, but I think in this case these are all balance changes on the account, and it’s ultimately all the same timeline.
From your diagram it looks like the categories could be different for either Income or Expenses, so having them in separate tables makes sense for me. If you combine them then you’ll need separate fields for the categories, which would end up being NULL for certain types.
EDIT: Having another think about it, you could have a single category table with a type, then a single transactions table. Then the transactions could have a single category field.
Protip: See if you can generate an Export from your bank and base your tables on that instead!
A friend wanted to make a personal finance tracking application because he wanted to know where his money disappeared to, but I told him that he’d get bored from tracking all the price lists he’d have to insert, so I recommended creating an export, load that in a DB and then use Grafana to generate some graphs, and he’s been quite happy with that.
Of course that’s not quite about what you’re asking, since this is about learning, but just sharing an idea :)
I appreciate the advice, I totally understand what you mean! The banks I have are pretty transparent with all my transactions in the last few months. I am also pretty diligent in regularly recording everything for myself, so I don’t rely on the banks for visibility on historical data. I’m the kind of person that would encourage you to do that, if we ever had a conversation about personal finance lol. I always try it as a concept for learning, say, a new framework because I’m familiar with the pain of doing it (not that my test projects are better than raw excel lol, but you get the idea).
Lately I kinda put in question the model I’ve been using and, after checking some of the answers here, I actually do want to learn a bit more about accounting practices, make something a bit more robust, closer to what would be expected from accounting software. I think it would be interesting to do something simple, hopefully something that would be useful to me.


