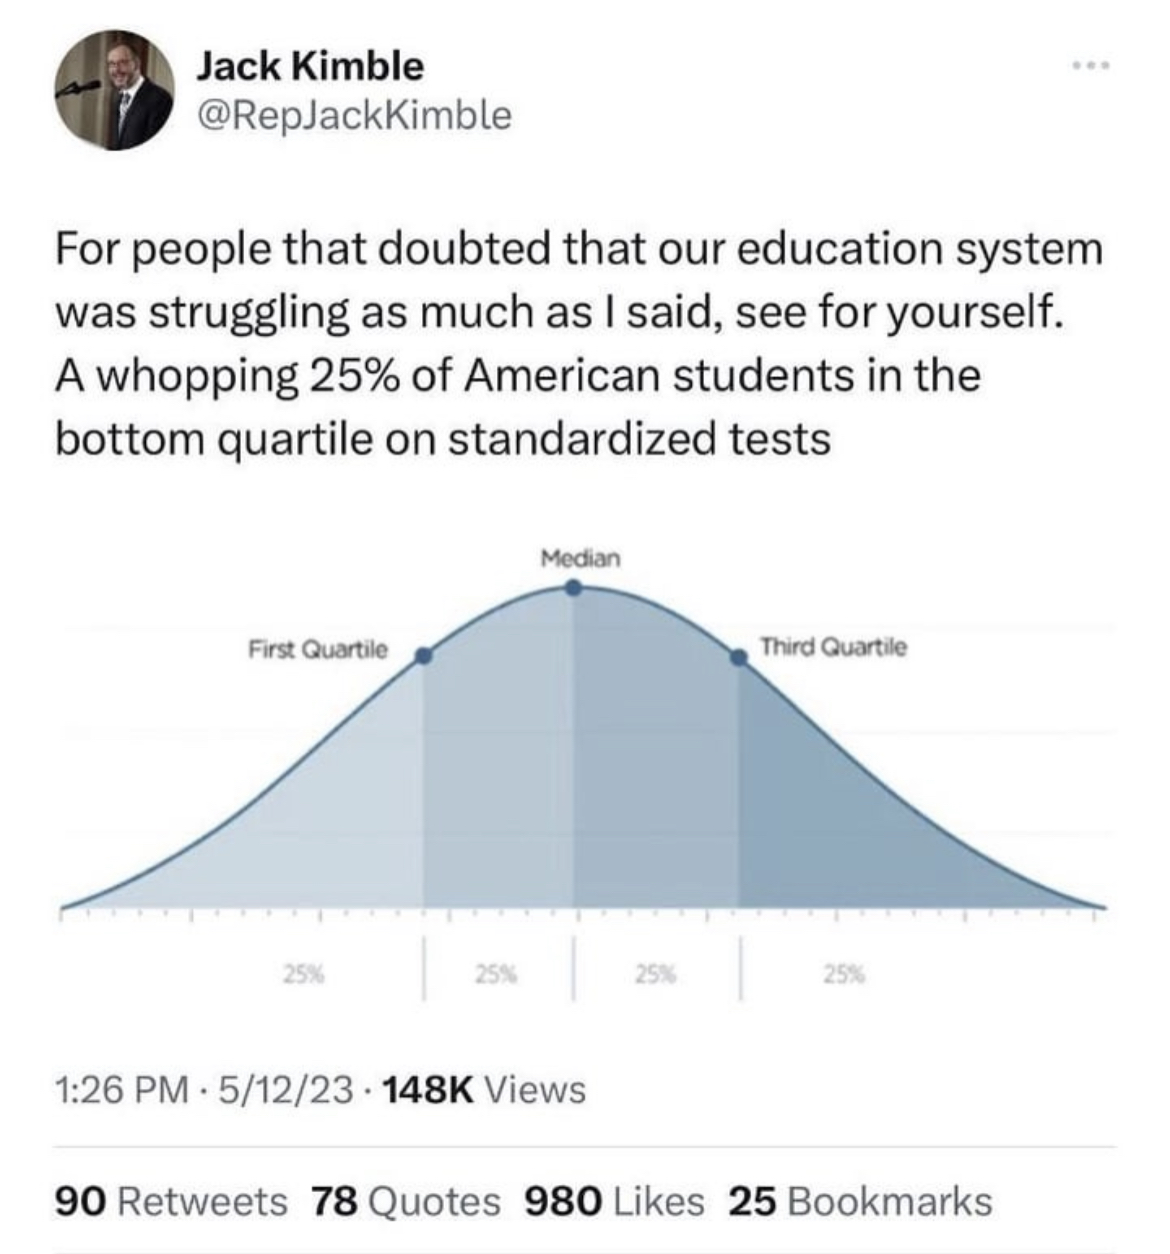
If ever a reliable method for measuring actual intelligence rather than IQ is invented I imagine we’ll be seeing a somewhat lumpier graph than that smooth mean distribution curve.
No, this is how a graph showing quartiles will always look because quartiles, by definition, always include a fixed percentage of the studied population under them.
In this case the lower quartile will always have 25% of the population under it, 50% under the second quartile, and 75% under the third quartile.
Quartiles break a population into 4 equal portions.
Spendrill is not misunderstanding the OP. He’s just saying that if intelligence could be measured by a better metric, then distribution of that metric among the population would not look as smooth as the one in the OP.
Not if you’re breaking the data into quartiles. Holy shit, do you really think the curve will be any different? Really? All that will happen is that some people will move around in the distribution. And the smoothing does not at all relate to how intelligence is measured but rather how it’s reported - in this graph.
Yes I think it’s very possible that if you were to graph a population’s Intelligence using a some empirical score, then it has a high probability to NOT look exactly like a normal distribution.
For example, let’s say that there was some score called “intelligence score” that scores people’s intelligence from 0-100. Do you think that if you were to graph a given population’s “intelligence score” that it would be EXACTLY centered around 50 in a Normal distribution? I think that’s unlikely. It’s more likely that there would be local maximums or minimums, or various skews in the graph. There could be a small peak at score 75, or a trough at 85. There could be all sorts of distributions.
And guess what? Given this hypothetical distribution, you could STILL draw lines somewhere on the graph showing quartiles. Those lines might not be at 25-50-75. They might not even be the same distance apart from each other. But you CAN draw them somewhere to split the scores. Just because a graph “has quartiles” does not mean it will always look like the OP.
I know what this graph is, I was talking about a graph that actually showed something useful. If you’ve got a couple of hours to learn something useful then you could do worse than to look at this video: https://www.youtube.com/watch?v=UBc7qBS1Ujo
At the end of the day, reducing intelligence down to one single number is already kind of questionable. What does it mean for someone to be 1 point more intelligent than another person?
It’s also, there are several different axes that you could measure intelligence along, spatial intelligence and awareness, emotional intelligence and so on. Also intelligence is a sliding scale, there are definitely times of the day, week month and year when I am less able to solve problems and more likely to cause them and then you’re into the social aspects, it’s been demonstrated that people’s ability to think straight is affected by how precarious their existence is and so on.
If you took a test as a child, it was probably WISC-V.
This assessment provides the following scores:
A Composite Score that represents a child’s overall intellectual ability (FSIQ)
Primary Index Scores that measure the following areas of cognitive functioning: Verbal Comprehension Index (VCI), Visual Spatial Index (VSI), Fluid Reasoning Index (FRI), Working Memory Index (WMI), and the Processing Speed Index (PSI).
Ancillary Index Scores are also provided: The Quantitative Reasoning Index (QRI) ; Auditory Working Memory Index (AWMI); Nonverbal Index (NVI); General Ability Index (GAI); and the Cognitive Proficiency Index (CPI).
Which seems very reasonable to me. This was originally intended to be an aptitude test, not strictly to measure your intelligence.
I don’t know, when I got tested it seemed like they were testing the right stuff.
I’m pretty sure it’s a well-made test that provides fairly accurate results. Even if what they claim to be measuring in each category isn’t reflected in the test, it is, at the very least measuring the abilities required to take the test and that exactly.
It seems pretty straightforward to see how good a kid is at solving a puzzle, right?
You could have communicated much more clearly. It was not at all clear that you understood the post and wanted to have a specific side discussion. It read like you were taking the post at face value to discuss the failure of IQ testing. It especially even more like a misunderstanding because the post wasn’t even about IQ tests, but standardized tests. In fact, your top level post and this one I’m responding to both felt snide to me. First snide about the graph and IQ tests, then snide about the fact that people didn’t understand your unclear communication. You came off as one of those snide reddit users zooming past the post to make a point, especially with your aggressive defenses. Slow down. Consider your messaging more carefully. We are here to have conversation. Make sure you are too.
I was definitely critical of the graph and of IQ. It’s a flawed concept created by people who were at best blind to cultural differences and at worst outright racist. [I’m sorry if you found my messaging unclear]<— I’m being absolutely genuine here, I was trying to make a serious point and if you misunderstood it then perhaps I could have been clearer. In future with these kinds of posts I’ll label it as off topic at the beginning.
I’m sure Lemmy wasn’t like this a month ago. What I was enjoying is that someone would make a post and then you could start a conversation that wasn’t strictly on topic just have an interesting talk about the general subject.
The worst thing about social networks is the people. Maybe we could just use ai to generate every response, fine tuned to the kind of conversation you specifically want. Yeah that’ll fix it.


If ever a reliable method for measuring actual intelligence rather than IQ is invented I imagine we’ll be seeing a somewhat lumpier graph than that smooth mean distribution curve.
No, this is how a graph showing quartiles will always look because quartiles, by definition, always include a fixed percentage of the studied population under them.
In this case the lower quartile will always have 25% of the population under it, 50% under the second quartile, and 75% under the third quartile.
Quartiles break a population into 4 equal portions.
While that’s true, the actual empirical curve does not have to be smooth. Or gaussian.
Spendrill is not misunderstanding the OP. He’s just saying that if intelligence could be measured by a better metric, then distribution of that metric among the population would not look as smooth as the one in the OP.
Not if you’re breaking the data into quartiles. Holy shit, do you really think the curve will be any different? Really? All that will happen is that some people will move around in the distribution. And the smoothing does not at all relate to how intelligence is measured but rather how it’s reported - in this graph.
Yes I think it’s very possible that if you were to graph a population’s Intelligence using a some empirical score, then it has a high probability to NOT look exactly like a normal distribution.
For example, let’s say that there was some score called “intelligence score” that scores people’s intelligence from 0-100. Do you think that if you were to graph a given population’s “intelligence score” that it would be EXACTLY centered around 50 in a Normal distribution? I think that’s unlikely. It’s more likely that there would be local maximums or minimums, or various skews in the graph. There could be a small peak at score 75, or a trough at 85. There could be all sorts of distributions.
And guess what? Given this hypothetical distribution, you could STILL draw lines somewhere on the graph showing quartiles. Those lines might not be at 25-50-75. They might not even be the same distance apart from each other. But you CAN draw them somewhere to split the scores. Just because a graph “has quartiles” does not mean it will always look like the OP.
I know what this graph is, I was talking about a graph that actually showed something useful. If you’ve got a couple of hours to learn something useful then you could do worse than to look at this video: https://www.youtube.com/watch?v=UBc7qBS1Ujo
At the end of the day, reducing intelligence down to one single number is already kind of questionable. What does it mean for someone to be 1 point more intelligent than another person?
It’s also, there are several different axes that you could measure intelligence along, spatial intelligence and awareness, emotional intelligence and so on. Also intelligence is a sliding scale, there are definitely times of the day, week month and year when I am less able to solve problems and more likely to cause them and then you’re into the social aspects, it’s been demonstrated that people’s ability to think straight is affected by how precarious their existence is and so on.
If you took a test as a child, it was probably WISC-V.
Which seems very reasonable to me. This was originally intended to be an aptitude test, not strictly to measure your intelligence.
This is supposed to quantify intelligence but how are these criteria quantified? Seems like the same fundamental issue
I don’t know, when I got tested it seemed like they were testing the right stuff.
I’m pretty sure it’s a well-made test that provides fairly accurate results. Even if what they claim to be measuring in each category isn’t reflected in the test, it is, at the very least measuring the abilities required to take the test and that exactly.
It seems pretty straightforward to see how good a kid is at solving a puzzle, right?
It’s the composite score, and especially the heavy emphasis on it as some innate unchangeable thing, that’s the questionable part.
Absolutely, but it’s still useful. Allegedly Alfred Binet did not approve of the eventual applications of the test he designed.
Is there a c/woosh?
Is there a c/IGotTheJokeJustWantedToMakeAGeneralPointAboutTheArtificialityOfIntelligenceQuotients
I swear if all the snide little pricks come over from reddit too I am going to have to abandon Lemmy also.
You could have communicated much more clearly. It was not at all clear that you understood the post and wanted to have a specific side discussion. It read like you were taking the post at face value to discuss the failure of IQ testing. It especially even more like a misunderstanding because the post wasn’t even about IQ tests, but standardized tests. In fact, your top level post and this one I’m responding to both felt snide to me. First snide about the graph and IQ tests, then snide about the fact that people didn’t understand your unclear communication. You came off as one of those snide reddit users zooming past the post to make a point, especially with your aggressive defenses. Slow down. Consider your messaging more carefully. We are here to have conversation. Make sure you are too.
I was definitely critical of the graph and of IQ. It’s a flawed concept created by people who were at best blind to cultural differences and at worst outright racist. [I’m sorry if you found my messaging unclear]<— I’m being absolutely genuine here, I was trying to make a serious point and if you misunderstood it then perhaps I could have been clearer. In future with these kinds of posts I’ll label it as off topic at the beginning.
Lol. People read your comment and think you didn’t understand the original post. When in reality they are the ones who didn’t understand your comment.
I’m sure Lemmy wasn’t like this a month ago. What I was enjoying is that someone would make a post and then you could start a conversation that wasn’t strictly on topic just have an interesting talk about the general subject.
The worst thing about social networks is the people. Maybe we could just use ai to generate every response, fine tuned to the kind of conversation you specifically want. Yeah that’ll fix it.
The worst thing about social networks is some of the people. Generally, they’re fine. Same in real life.
It would almost certainly follow an approximate normal distribution just like the above graph. Why would it look different?