![Reddit Activity 08 - 28 June [OC]](https://lemmy.world/pictrs/image/26da7bca-cff6-4b5f-a983-22436545e922.png)
During the Reddit Blackout i made a graph showing the posts and comments/day (Link).
Some days ago i was asked to make an Update so here it is.
Source Data is from here and contains the same Data as some may know from here. Only difference is that the post and comment count is summed over the day.
EDIT:
The Original Post Data contained inconsistent Data points on each day (see here).
This is the corrected Chart, which uses the difference in Post IDs between the days to calculate the daily number (adjusted to s between the api calls):
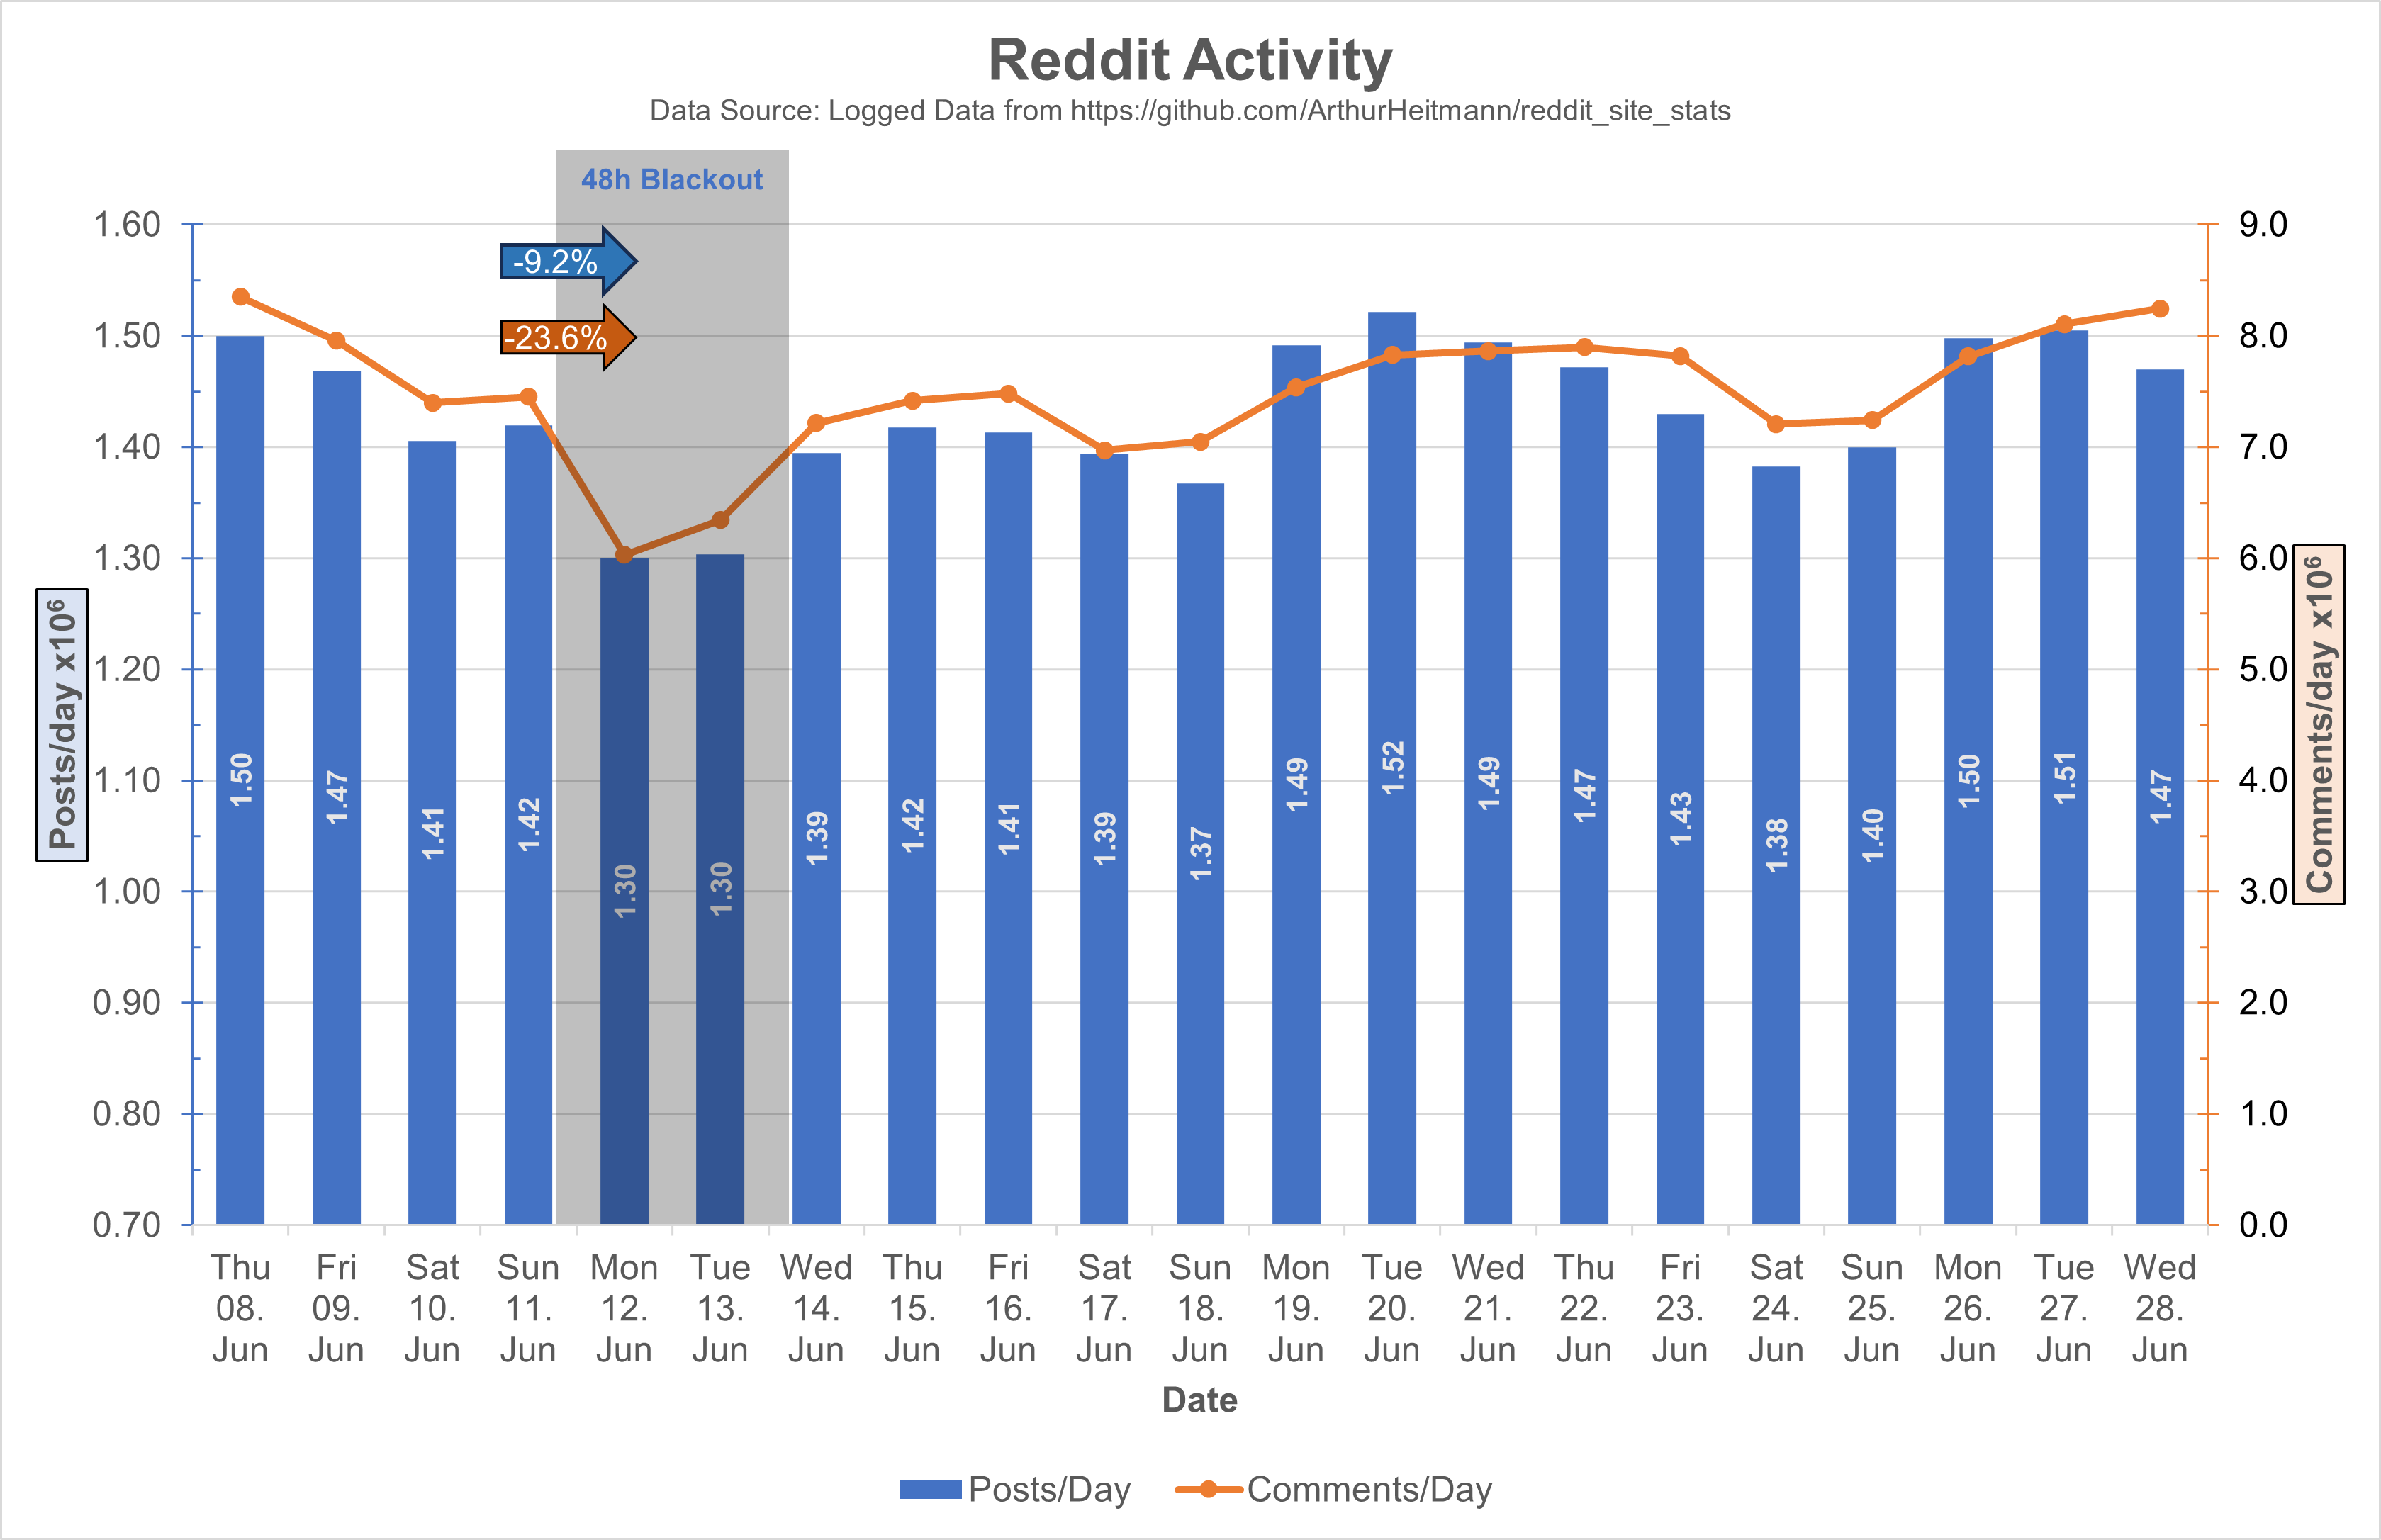
I also adjusted the values to 10^6 and adjusted the y-axis ranges, I hope this makes it easier on the eyes.
For people complaining on the mixed chart: Double column looks bad with 2Y-Axis, and double lines looks too empty. 2Y-Axis are necessary cause of the difference in scaling of the posts and comments data, only other option would be an axis break.
Hi, thanks for your work and good point.
It is as you said, I am just summing the data since I don’t know the Post and Comment Id format and how to convert it into a number. Is it Base64?
Here an Overview over your coverage though:
I guess this explains the higher number on the 8-9th. There seems to be a timeframe with 30 second pull intervalls on these days
Almost, it’s base 36. I’m using these functions for converting them. The ID is incremented for each new post/comment. So the difference between the last and first post ID of a day, is the total number of posts on that day. In that coverage you can see pretty well the 2 days where my internet was struggling and when I switched to cloud hosting.
Thanks, I adjusted the counting using the ID now.
Is it ok if I make another Update using your source data next week? Or are you gonna stop the tracker on the 1st July cause of the API changes? If I am not mistaken it shouldn’t get hit by the changes since the API calls are too low right?
Yeah that looks more like it.
You can make however many posts you want :)
I will keep it running for at least a week or two after July 1st, then I’ll have to see, because the subreddit related data is growing quite quickly (300MB) and the per minute chart is quite dense now.
Perfect thanks :)