lars@lemmy.sdf.org to Map Enthusiasts@sopuli.xyzEnglish · 4 months agoIf Clinton, Trump, and Did Not Vote were presidential candidates in 2016brilliantmaps.comexternal-linkmessage-square190fedilinkarrow-up1929arrow-down123
arrow-up1906arrow-down1external-linkIf Clinton, Trump, and Did Not Vote were presidential candidates in 2016brilliantmaps.comlars@lemmy.sdf.org to Map Enthusiasts@sopuli.xyzEnglish · 4 months agomessage-square190fedilink
minus-squareWIZARD POPE💫@lemmy.worldlinkfedilinkarrow-up17·4 months agoDoes the top graph not just show that all the gray states had people that did not vote be the largest percentage. So if for example 30% voted for Biden and 31% for Trump, you still have 39% that did not vote thus making the non voter ‘candidate’ win. In this case the voter turnout is 61% yet the non voters represent the biggest share.

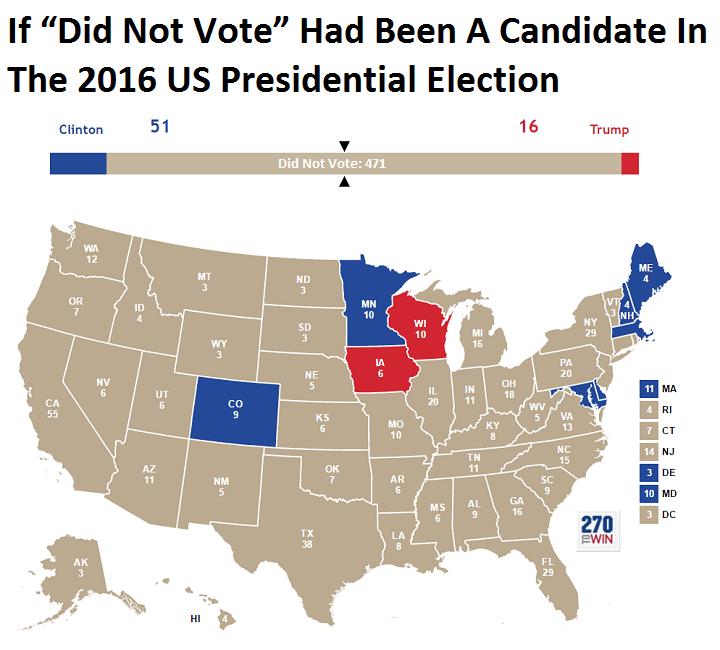
Does the top graph not just show that all the gray states had people that did not vote be the largest percentage.
So if for example 30% voted for Biden and 31% for Trump, you still have 39% that did not vote thus making the non voter ‘candidate’ win.
In this case the voter turnout is 61% yet the non voters represent the biggest share.